Tracing Project Overview Template
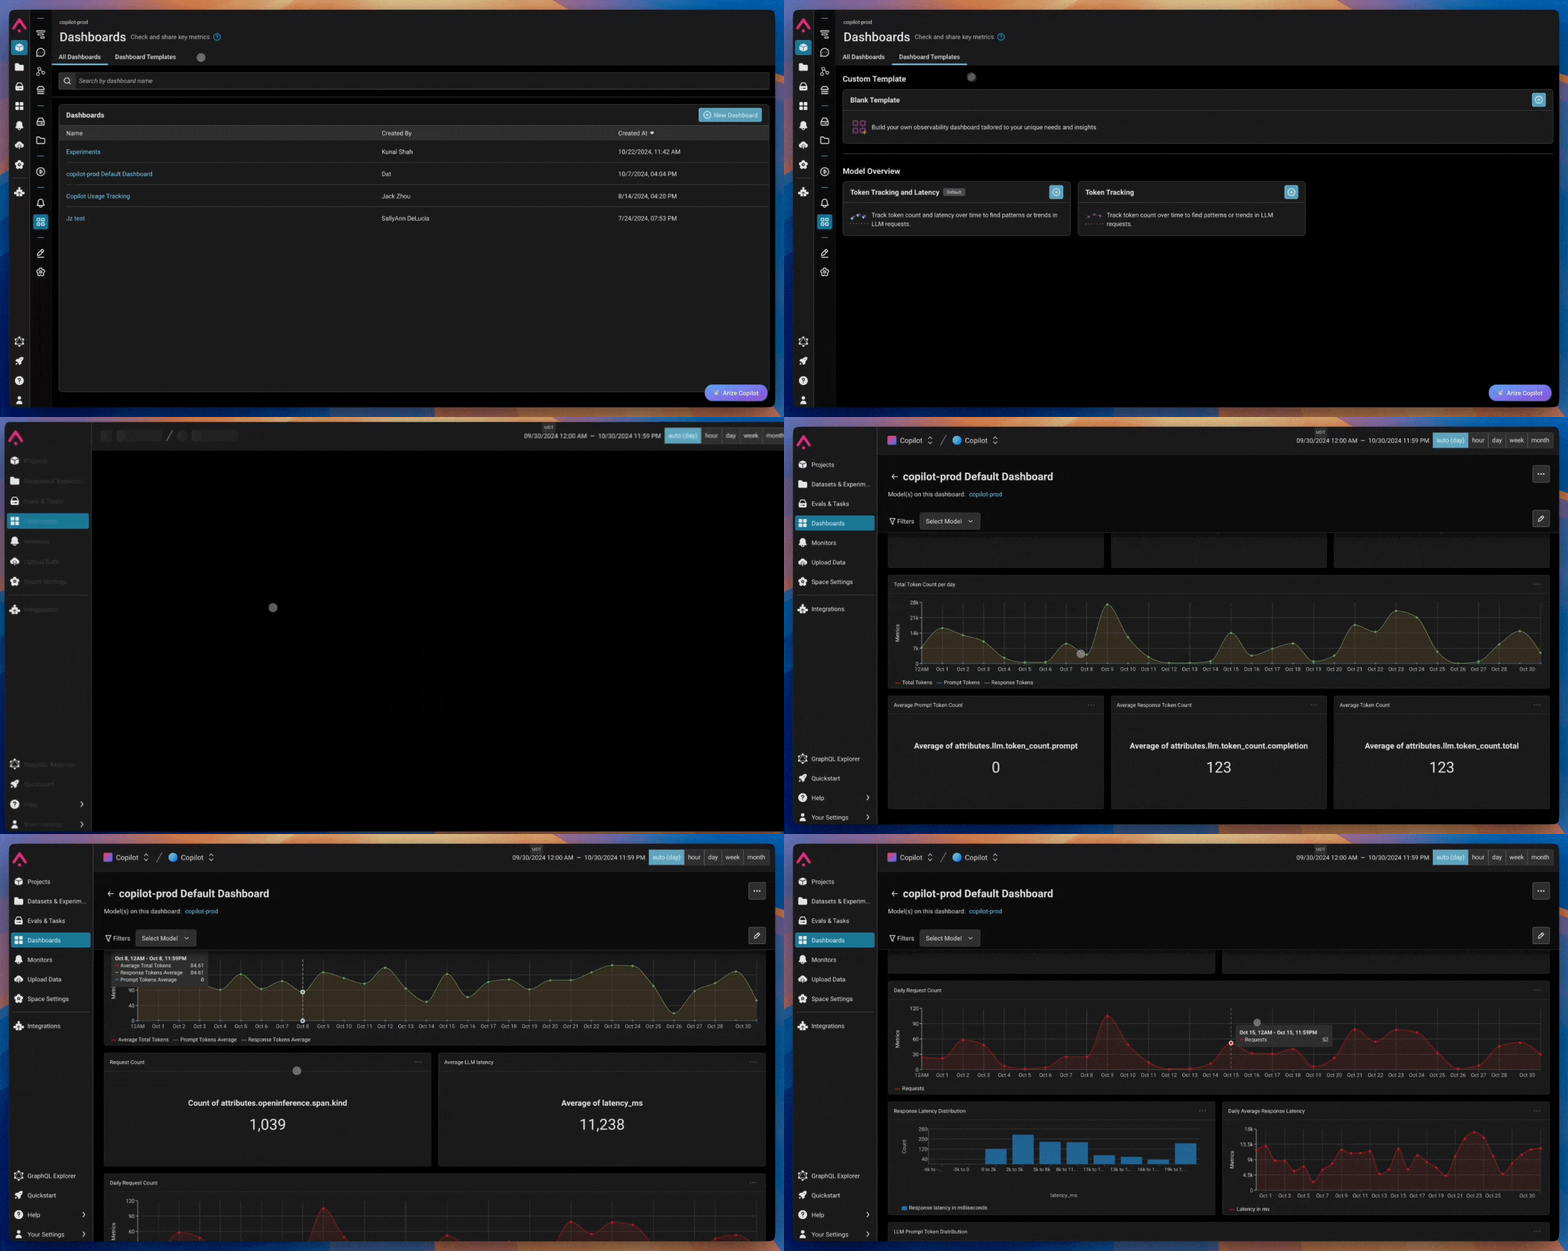
This default dashboard template gives an overview of the health and performance of a tracing project. It shows a comprehensive set of metrics, including trace volume, errors, latency, token usage, and more. Add or edit widgets to customize the dashboard once it’s created. This template includes:- Trace Volume and Errors: Monitors the total volume of requests and the number of requests with errors.
- Latency: Measures average span latency and provides a distribution of latency to identify outliers.
- Model Performance: Shows total token count and total cost for each of the models in this project.
- Token Usage: Tracks the count of total, prompt, and completion tokens used over time.
- Average Cost: If cost is set up for this project, displays the average cost over time and a breakdown of total, prompt, and completion cost over time.
- Average Eval Scores: If there are evals set up for this project, tracks the average score for evals over time to show how the application is performing. This shows a subset of the evals in project to start and can be edited to show more or different evals.
Token Tracking and Latency Template
This dashboard template is designed for generative applications, offering essential insights into key usage and performance metrics. The template includes:- Total Prompt and Completion Token Counts: Tracks the cumulative count of tokens used for prompts and completions over time.
- Average Prompt and Completion Token Counts: Provides insights into the average token usage, ensuring prompts and responses remain efficient.
- Number of Requests: Monitors the total volume of requests to gauge application demand.
- Average Latency: Measures average response time, helping teams optimize performance and user experience.

Custom Dashboards
Create a custom dashboard tailored to your needs by leveraging our diverse widget types, allowing for flexible and insightful visualizations:- Timeseries Widget: Visualize trends in custom metrics or spanProperty quality metrics (e.g., average, count, median, cardinality) over time. Great for monitoring spikes in token usage, errors, or business-specific metrics.
- Distribution Widget: See the distribution of evaluation labels or spanProperty values. Ideal for analyzing usage by user, tool usage, or your evaluation results.
- Experiments Widget: Track experiment outcomes by selecting datasets and evaluators, making it easy to visualize and compare results over time.
- Statistic Widget: Get an aggregate view of a custom metric or spanProperty quality metric. Perfect for quickly seeing overall counts, averages, or sums.
- Text Widget: Add context or notes to your dashboard by embedding text, keeping everyone aligned on the purpose or focus of the displayed data.
Using Dashboards
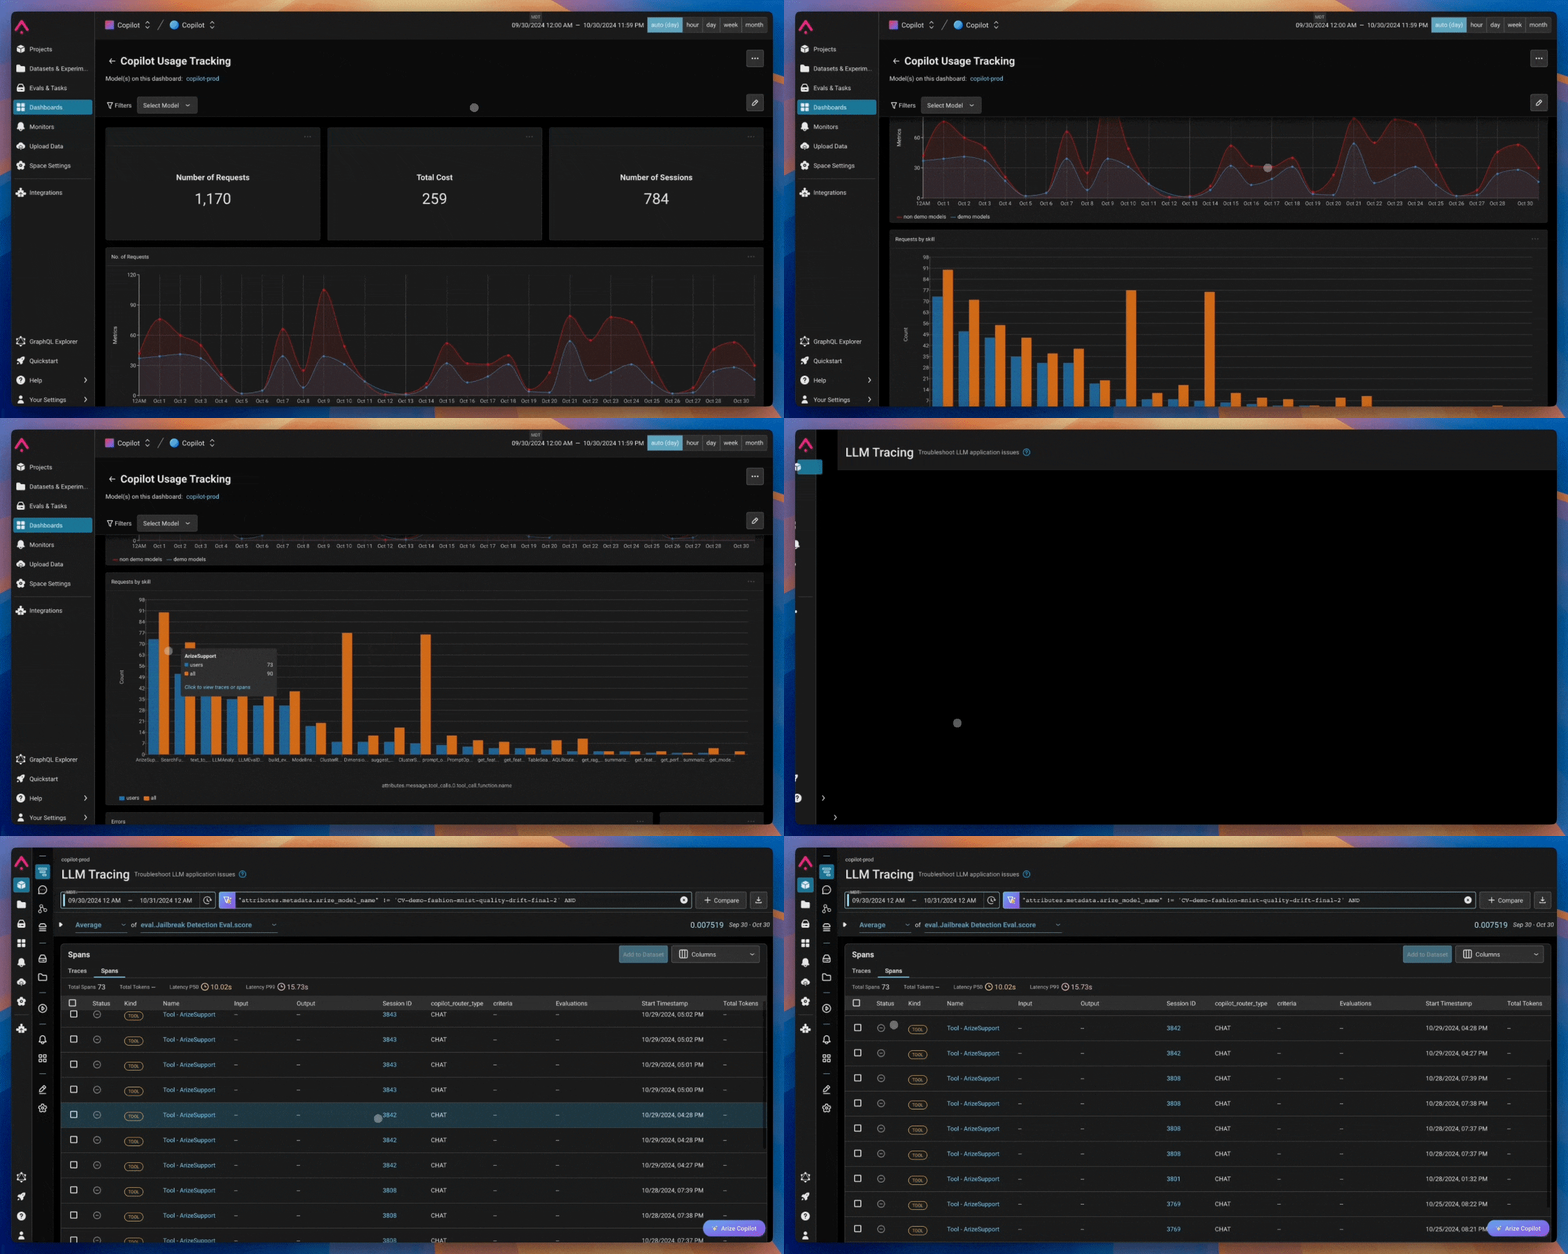
Dashboards offer a high-level overview of your application, ideal for daily check-ins to monitor performance and usage patterns. With global filters, date selectors, and interactive charts, you can dive deeper to view specific traces or experiment details. Dashboards not only provide a quick, comprehensive view but are also a powerful tool for gaining detailed insights, helping you stay on top of key metrics and optimize application performance effectively.\