Documentation Index
Fetch the complete documentation index at: https://arize-ax.mintlify.dev/docs/llms.txt
Use this file to discover all available pages before exploring further.

Google Colab
- Author a tool-calling LangGraph agent wrapped with
ChatAgentand Arize AX auto-instrumentation for tracing - This agent has the capability to generate and execute python code in a stateless sandboxed environment
- Log and deploy the agent
- Evaluate the agent’s python code using Arize AX LLM as a Judge evaluation
- Invoke the agent and view traces and evaluation results in the Arize AX platform
- Set up evaluation custom metrics and view them in monitors and dashboards in Arize AX
Prerequisites
- Databricks account and workspace (Sign up for free)
- Arize AX account (Sign up for free)
- Address all
TODOs in this notebook.
Install Dependencies
Access Arize AX Space and API Keys from Databricks Secrets and set them as Environment Variables
Create a Arize AX API key and Space ID for the items below.Set up Arize AX credentials using Databricks Secrets for secure access of keys.
Create a local configuration file to store project settings:
Create a file named “chain_config.yaml” with variables below. It should reside in the same folder as the notebook. These variables will be accessed from the agent code. Replace the example values with your own values:
ARIZE_PROJECT_NAME="databricks-langgraph-tool-calling-agent"LLM_ENDPOINT_NAME="databricks-claude-3-7-sonnet"
Define the agent in code
Define the agent code in a single cell below. This lets you easily write the agent code to a local Python file, using the%%writefile magic command, for subsequent logging and deployment.
Tracing auto-instrumentation
Opentelemetry based auto-instrumentation for Langgraph exports traces to Arize AX.
Agent tools
This agent code adds the built-in Unity Catalog function system.ai.python_exec to the agent. The agent code also includes commented-out sample code for adding a vector search index to perform unstructured data retrieval.
system.ai.python_exec - Executes Python code in a stateless sandboxed environment and returns its stdout. The runtime cannot access files or read previous executions’ output. All operations must be self-contained, using only standard Python libraries. Calls to other tools are prohibited.
For more examples of tools to add to your agent, see Databricks documentation (AWS | Azure)
Wrap the LangGraph agent using the ChatAgent interface
For compatibility with Databricks AI features, the LangGraphChatAgent class implements the ChatAgent interface to wrap the LangGraph agent. This example uses the provided convenience APIs ChatAgentState and ChatAgentToolNode for ease of use.
Databricks recommends using ChatAgent as it simplifies authoring multi-turn conversational agents using an open source standard. See MLflow’s ChatAgent documentation.
Restart Python and reset environment variables
Log the agent as an MLflow model
Log the agent as code from theagent.py file. See MLflow - Models from Code.
Enable automatic authentication for Databricks resources
For the most common Databricks resource types, Databricks supports and recommends declaring resource dependencies for the agent upfront during logging. This enables automatic authentication passthrough when you deploy the agent. With automatic authentication passthrough, Databricks automatically provisions, rotates, and manages short-lived credentials to securely access these resource dependencies from within the agent endpoint. To enable automatic authentication, specify the dependent Databricks resources when callingmlflow.pyfunc.log_model().
- TODO: If your Unity Catalog tool queries a [vector search index](docs link) or leverages [external functions](docs link), you need to include the dependent vector search index and UC connection objects, respectively, as resources. See docs (AWS | Azure).
Pre-deployment agent validation
Before registering and deploying the agent, perform pre-deployment checks using the mlflow.models.predict() API. See Databricks documentation (AWS | Azure).Register the model to Unity Catalog
Before you deploy the agent, you must register the agent to Unity Catalog.- TODO Update the
catalog,schema, andmodel_namebelow to register the MLflow model to Unity Catalog.
Deploy the agent
Configure Online Evaluations in Arize AX
Follow instructions here to setup up online evaluations in Arize AX. Arize AX’s Online Evaluations automatically run LLM-as-a-Judge based evaluations directly on the traces collected in the Arize AX platform from our Agent runs. This provides continuous quality monitoring without manual intervention. This approach scales to thousands of interactions, enabling data-driven improvements to your agent’s performance. These evaluations are for assessing code generation quality that the agent produces, specifically:- Code Correctness: Does the generated code solve the user’s problem accurately?
- Code Readability: Is the code clean, well-structured, and maintainable?
- LLM-as-a-Judge evaluation best practices: (Arize AX docs)
- Agent evaluation best practices: (Arize AX Docs)
- Automate running evaluations on your Traces and Spans: (Docs)
Call the Agent
There are several methods we can use to call our newly deployed agent in Databricks.- REST API Calls: You can invoke your deployed agent through HTTP POST requests to the model serving endpoint. This method provides programmatic access, allowing you to integrate the agent into applications or automated workflows by sending JSON payloads with your input data and receiving structured responses.
- Model Serving UI: Databricks provides a built-in web interface where you can directly test your deployed agent. Simply navigate to the serving endpoint in the Databricks workspace, use the “Test” tab to input sample data, and see real-time responses without writing any code.
- Databricks AI Playground: This interactive environment lets you experiment with your agent in a conversational interface. You can test different prompts, observe the agent’s behavior, and refine your interactions before implementing them in production scenarios.
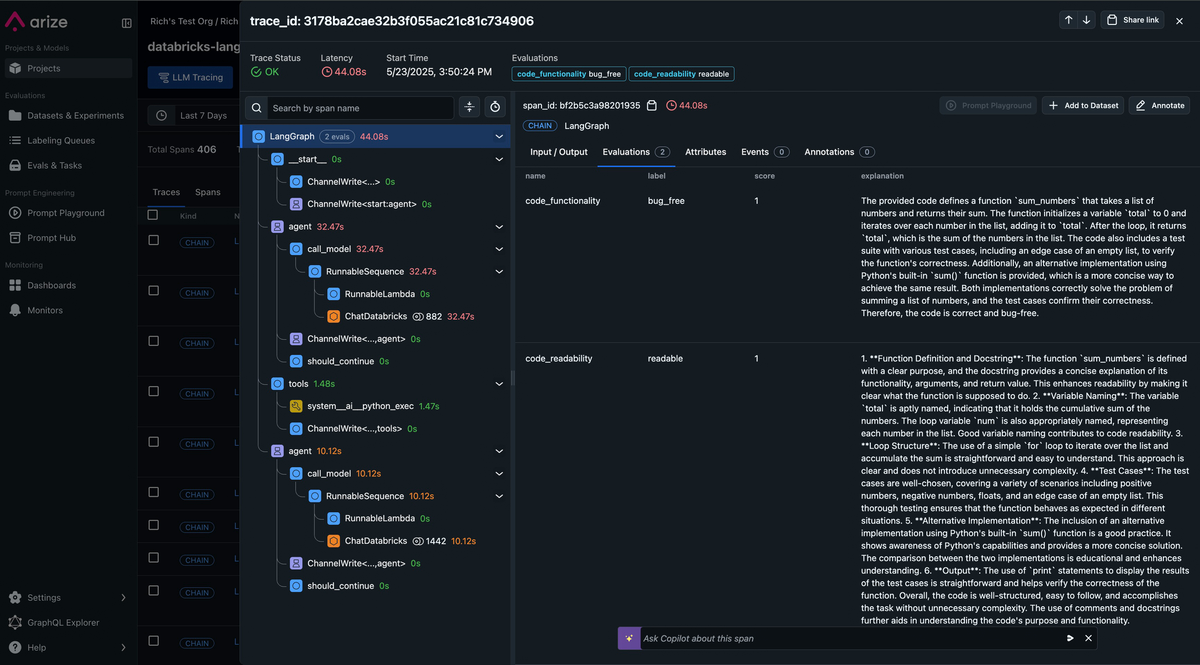
View traces and evaluation results in Arize AX
As you run your agent, traces are automatically sent to Arize AX. In the Arize AX platform, you can see agent execution details, tool invocations, latency breakdown by component, token usage and costs, errors and metadata captured for each span and function call. Additionally, evaluation labels are captured for every trace based on the code correctness and code readability evals we setup earlier.
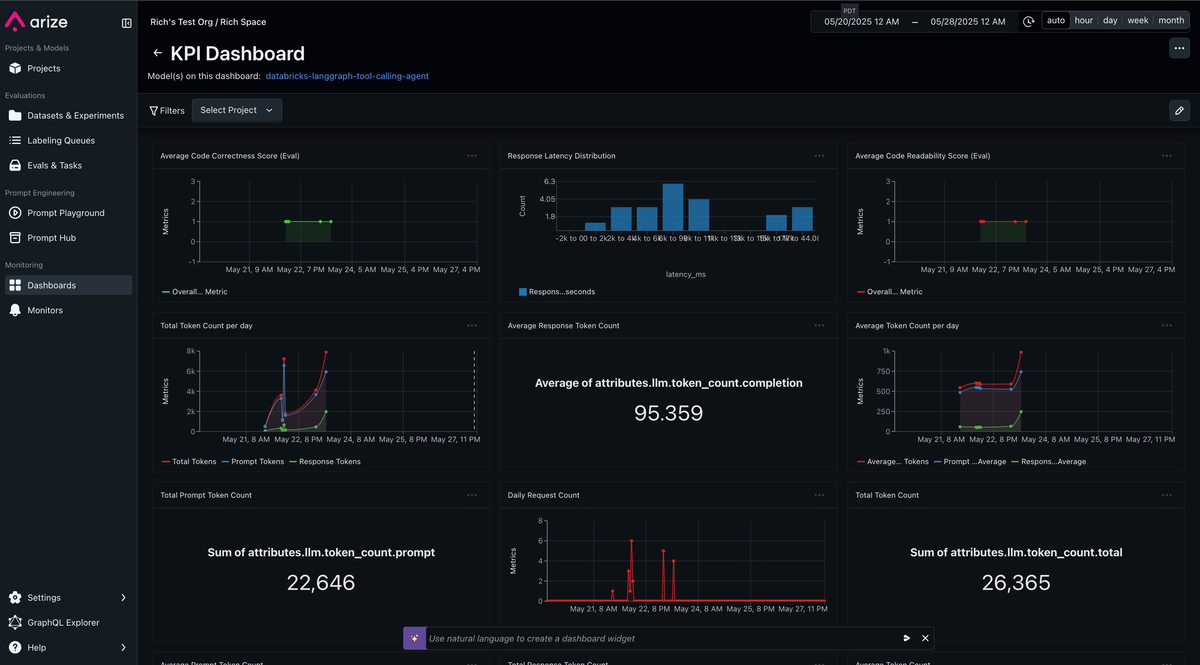
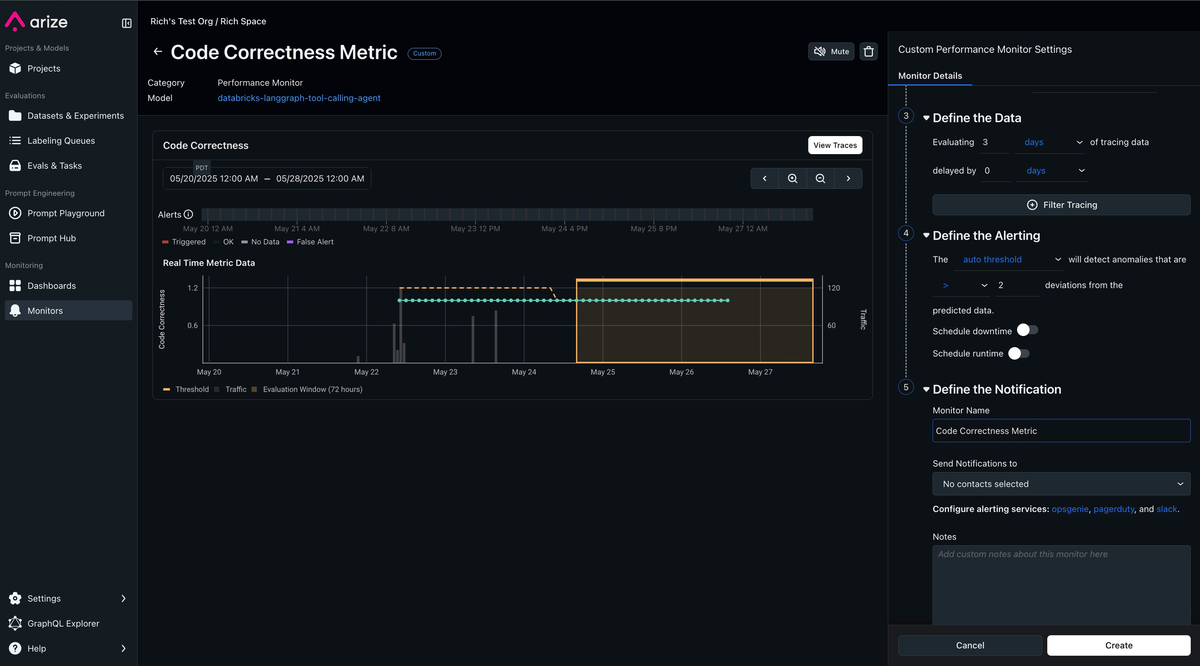
Monitoring, alerting and KPI dashboards in Arize AX
Turn any trace attribute and evaluation label into custom metrics. Build KPI driven dashboards and monitors that proactively alert you when any degradation in performance or quality of your agent occurs.